Location
Mount Vernon, WA 98274
Location
Mount Vernon, WA 98274

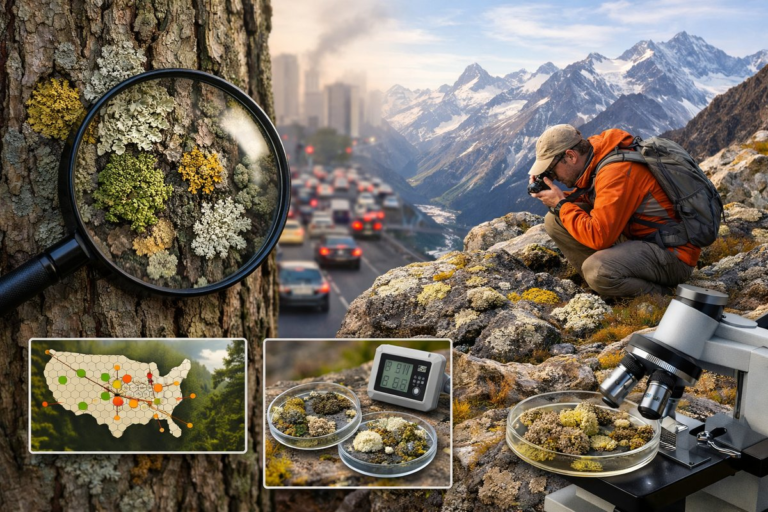
An international consortium has launched the Living Atlas, an interactive map weaving together soil networks, seasonal blooms, and starlit skies. By blending remote sensing, citizen science, and AI, this tool reveals hidden patterns in forests, meadows, coasts, and night skies-inviting all of us to notice, remember, and belong in the living world.
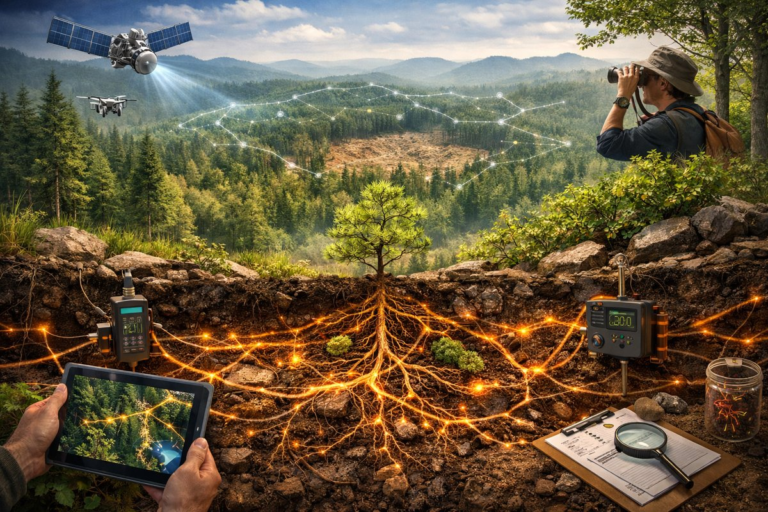
Last week, researchers and community volunteers around the globe celebrated the launch of the Living Atlas, an ambitious project designed to chart the intricate dance of life on Earth. Far more than a static map, this digital atlas layers real-time data from soil carbon sensors, canopy imaging drones, alpine phenology reports, coastal water quality monitors, and stargazing stations. Its aim: to illuminate the subtle connections linking mycelial networks beneath our feet, first blooms in high meadows, bioluminescent bays, and the shifting tapestry of stars above.
At the heart of the Living Atlas is a spirit of shared exploration. For decades, scientists have tiptoed around the idea of a singular, living portrait of our planet, hampered by siloed data and regional fragmentation. Now, an international consortium of ecologists, data scientists, Indigenous knowledge holders, amateur naturalists, and dark-sky advocates have pooled their expertise. The result is a modular platform that anyone can browse, contribute to, and remix-whether they live in a remote mountain village or a bustling city suburb.
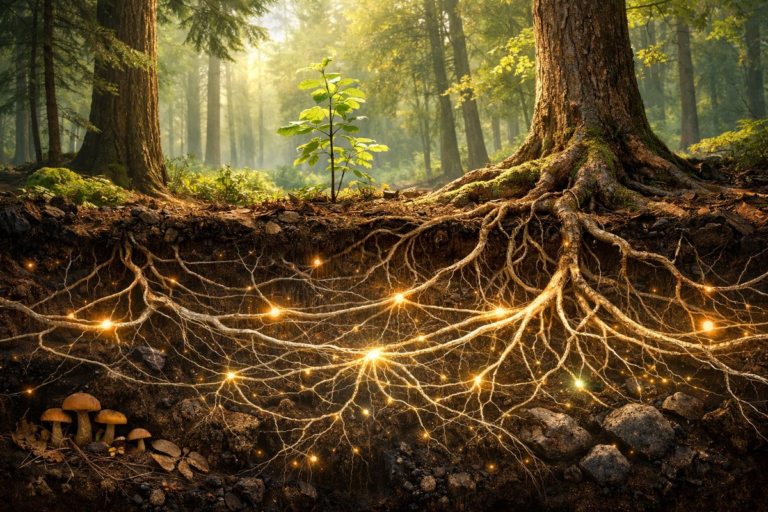
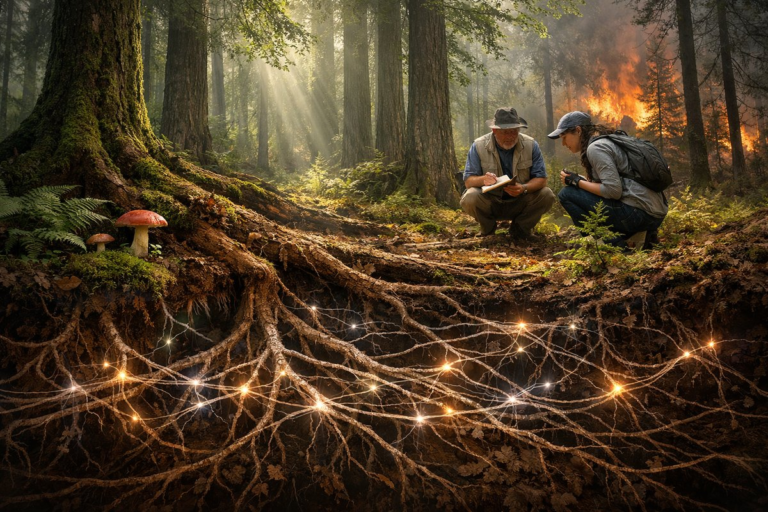
The project’s backbone consists of three core streams of information. First comes the soil and root network mapping: a network of low-cost subterranean sensors buried in temperate forests measures moisture, microbial respiration, and carbon flux. These are paired with high-resolution aerial images capturing seasonal changes in canopy leaf area. Together, they reveal hidden pulses of growth and decay, the rise of fungal highways that shuttle nutrients between trees, and the forest’s epic response to droughts and storms.
Next is the phenology tracker, powered by a free smartphone app. Users log first flowers, leaf color changes, insect emergences, and autumn leaf fall. Within days of the Living Atlas’s soft launch, more than 30,000 entries poured in from hikers in alpine grasslands, backyard gardeners, and students at coastal marine labs. These time-stamped, geo-tagged observations help chart how warming winters and shifting rainfall patterns alter seasonal rhythms from the Rockies to the Alps.
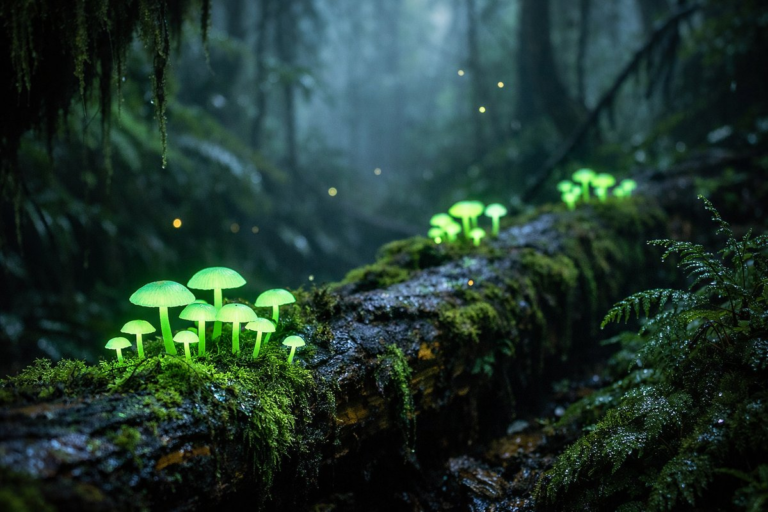
Finally, the atlas integrates dark-sky monitoring. Dozens of backyard telescopes and simple sky brightness meters feed data on light pollution levels and meteor showers. Citizen astronomers report nocturnal animal calls, glow-in-the-dark fungi sightings, and unexpected firefly emergences. This fusion of astronomy and biology underscores how artificial light, or its absence, shapes life on land and in our imaginations.
“We wanted to build something that mirrors the living web,” explains one leading ecologist involved in the project. “When soil microbes wake up, you see changes in CO₂ flux. When trees bud early, you get a cascade of insect hatches. When artificial lights dim, whole nocturnal communities resurface. Nobody has ever stitched these threads together at planetary scale.”
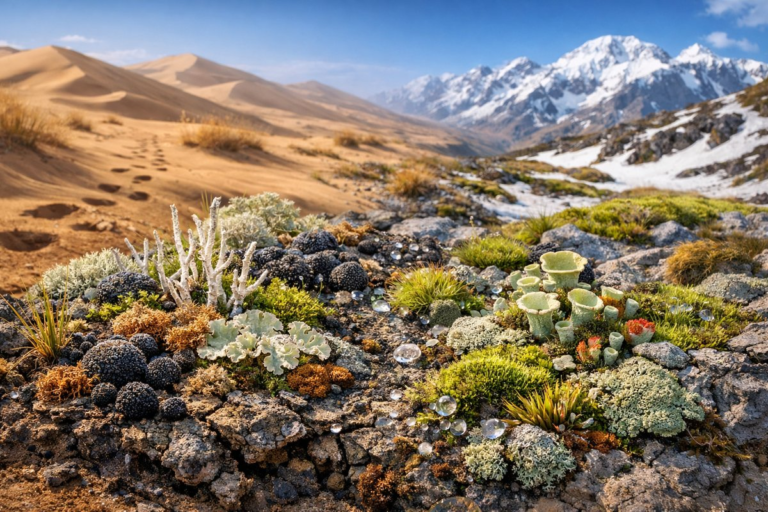
The Living Atlas doesn’t stop at raw data. It also offers story modules-curated narratives that synthesize multiple data streams into local milestones. One story traces an alpine meadow in the Rockies, where earlier snowmelt now brings a wave of wildflowers weeks ahead of schedule. This shift has created mismatches between pollinators and blossoms. Beekeepers in the region have adapted by relocating hives to higher elevations, while park rangers experiment with selective shading canopies to extend bloom windows.
Along the Gulf Coast, another module tracks the return of bioluminescent algae in protected bays. Water temperature sensors and colored-light underwater cameras captured the first major bloom in a decade. Community groups attribute this revival to a recent ban on single-use fertilizers upstream and a new wetland buffer restoration project. Fisherfolk, scientists, and schoolchildren documented the glowing tides, prompting a local ordinance to expand riparian green spaces.
In the heartland, ranchers partnered with soil ecologists to map underground mycorrhizal networks on grazed grasslands. By rotating livestock and restoring native prairie grasses, they doubled soil organic matter in just two years. The Living Atlas pulled in imagery showing deeper earth humus, carbon dioxide drawdown, and richer spring wildflowers-proof that regenerative practices can yield measurable climate and biodiversity gains.
Meanwhile, in a small desert community in the Southwest, a coalition of educators and amateur astronomers used the atlas’s dark-sky layer to win designation as a Community Dark Sky Sanctuary. With new streetlight ordinances and shielded fixtures, residents witnessed the Milky Way arching bright overhead for the first time in generations. Nocturnal wildlife-javelinas, owls, and desert scorpions-soon reclaimed the night, and local businesses began offering stargazing tours that support both ecotourism and conservation.
These examples illustrate a core value of the Living Atlas: resilience through connection. When individuals and communities see the living world as a dynamic, interwoven system rather than isolated parts, they gain agency to safeguard it. By tracking phenology, soil health, and light pollution in one glance, the atlas offers a holistic roadmap for climate adaptation, land stewardship, and cultural renewal.
Contributors praised the platform’s friendly, modular design. Layers can be toggled on or off, data can be downloaded for local use, and educators can embed interactive widgets in lesson plans. An open API means developers can prototype new tools-such as an AI-powered bloom predictor or a night-vision wildlife camera network that syncs with the sky brightness index.
Privacy advocates also played a key role, ensuring that sensitive location data-like the precise coordinates of endangered plant populations-is obfuscated or aggregated. This balance of openness and caution helps protect vulnerable species while still empowering community science.
For readers eager to join the exploration, the atlas offers several entry points. Download the phenology app and record your neighborhood’s first spring blossoms or autumn color change. Host a backyard sky-watching party using the dark-sky toolkit and contribute light-pollution measurements. Volunteer at a local soil-health workshop, where you can learn to install a simple carbon sensor beneath your lawn or community garden.
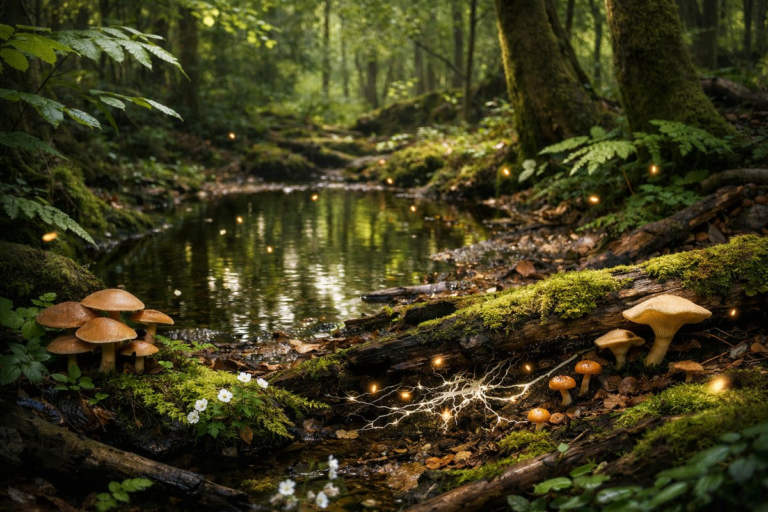
Beyond data collection, the Living Atlas encourages reflection. In a dedicated “Moments of Wonder” section, users share photos and poems inspired by emergent mushrooms carpeting riverbanks, glowing plankton under a moonless night, or the first trill of migrating songbirds at dawn. This creative space reminds us that awe and curiosity are vital threads in the fabric of environmental stewardship.
As climate extremes intensify, the Living Atlas arrives at a critical moment. It reveals not only how landscapes are shifting, but also how human ingenuity, cooperation, and reverence for nature can turn knowledge into hope. The map reminds us that resilience is built not in isolation, but through countless acts of noticing, recording, and sharing.
In the words of one Indigenous collaborator, “Our ancestors watched the stars and flowers for guidance. Today, we watch them to remember who we are and where we belong.” The Living Atlas is an invitation to reignite that tradition of close observation-an open door to the quiet awe and curious exploration that renew our bonds with the living world.
Whether you wander forest trails, tend a community garden, paddle a dark bay by lantern light, or simply gaze skyward from your rooftop, the Living Atlas can be your guide. Tune in to its layers, contribute your own observations, and discover how every bloom, spore, and starlight shimmer connects us all.