Location
Mount Vernon, WA 98274

Location
Mount Vernon, WA 98274
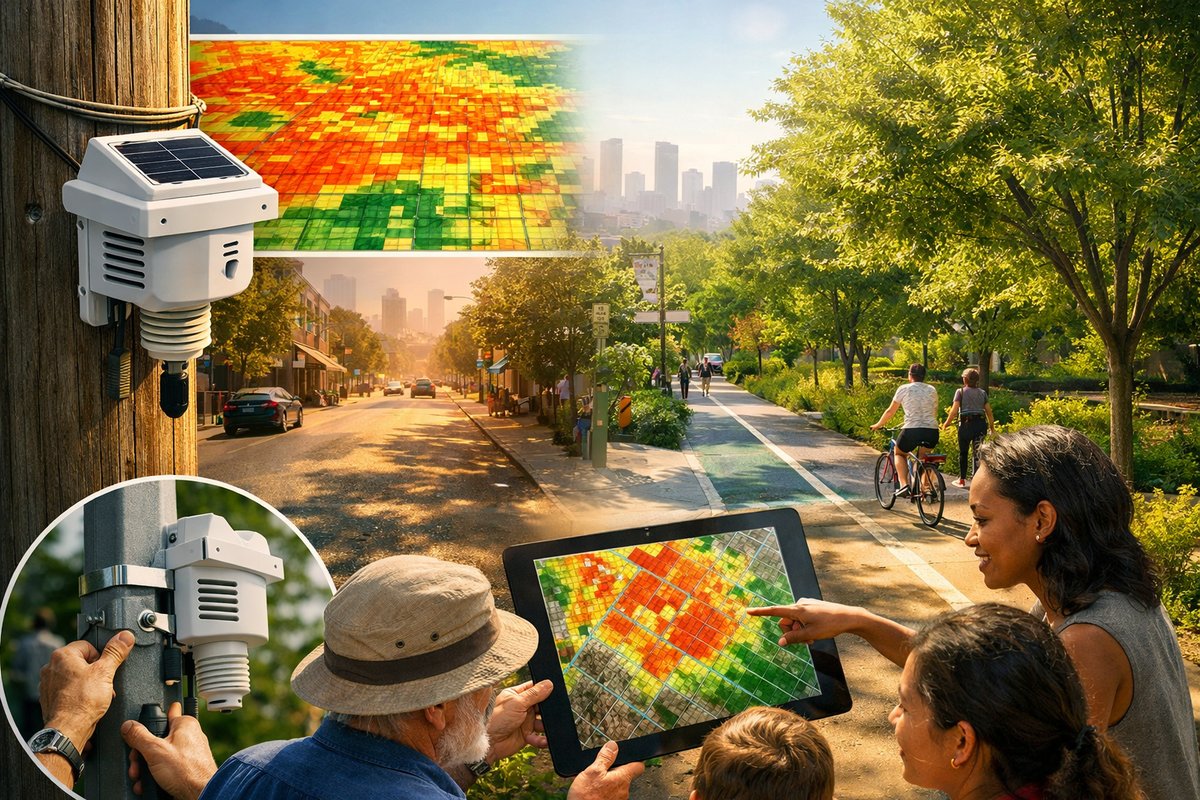
A new network of low-cost sensors installed by residents across multiple neighborhoods is generating high-resolution maps of urban heat patterns. The project's findings are revealing temperature swings of up to five degrees within the same city block and empowering communities to demand greener, cooler streets.
Cities are famously warmer than the surrounding countryside, a phenomenon known as the urban heat island effect. But until recently, most data collected by meteorological agencies missed the fine-grained temperature variations that occur from one street to the next. Now, an ambitious citizen science initiative is changing that. Equipped with inexpensive temperature and humidity sensors, volunteers have created a web of monitoring stations that delivers minute-by-minute readings at sidewalk level, illuminating the hidden microclimates of their own neighborhoods.
The sensor nodes themselves are simple devices: a battery-powered data logger, a temperature-humidity probe, and a small solar cell to extend operational life during the long summer months. Participants mount them on lamp posts, balcony railings or park benches, then register each unit’s GPS coordinates through an open-source smartphone app. From there, the devices transmit readings every five minutes to a cloud platform designed by the project’s engineering team. The entire hardware and software stack is available under public licenses, enabling anyone with basic wiring skills to build and deploy a monitoring station in under an hour.
Once the stream of environmental readings begins, the magic happens in the data visualization portal. A dynamic heat map shows real-time temperature gradients, allowing users to pan across districts and see exactly where pavement has baked in the afternoon sun or where tree-shaded sidewalks stay ten degrees cooler. Historical playback makes it easy to compare patterns from one day or one season to the next. Over the past six months, the network has logged more than ten million data points, creating perhaps the most detailed urban microclimate atlas ever assembled by non-experts.
Preliminary analysis has already yielded surprising insights. In one midsize city, sensors spaced less than a hundred meters apart showed swings up to five degrees Celsius on the same summer afternoon-differences driven by tree canopy density, building materials, and even the color of rooftop coatings. In another neighborhood, a community garden surrounded by mature oaks registered peak temperatures nearly four degrees lower than adjacent asphalt parking lots. These contrasts matter: every additional degree of heat intensifies air pollution, increases the risk of heat stroke, and drives up energy demand for air conditioning.
Public health professionals are taking note. With local health departments issuing heat advisories during record-breaking heat waves, fine-scale temperature maps help pinpoint the most vulnerable blocks. Mobile cooling clinics and shade-tent deployments can be directed precisely where residents lack access to green space. In cities with large elderly populations, these targeted interventions stand to prevent heat-related hospitalizations and save lives.
Urban planners and city councils have also begun to integrate the data into long-range zoning and building code revisions. Proposals include requirements for reflective roofing materials in commercial districts, expanded tree-planting incentives in residential blocks, and redesigned bus stops featuring heat-resilient seating. Some municipalities are even experimenting with “cool pavement” – specially treated sidewalk tiles that reduce surface temperatures by reflecting more sunlight. All of these measures gain momentum when backed by hard data gathered from the community itself.
“It’s rare to see residents take on the dual role of data collector and urban advocate,” says one of the project’s coordinating scientists. “The sensors aren’t just tools-they’re conversation starters. When local stakeholders see real numbers showing how hot their street becomes, they become invested in solutions. That’s grassroots science at its best.”
For homeowners who volunteered to host a sensor, the experience has felt empowering. One participant in a densely built neighborhood described watching the live dashboard from her kitchen table as temperatures climbed past thirty degrees one afternoon. Within days, she and a neighbor successfully lobbied the city for extra tree plantings on their block. “Before this project, heat was just something we complained about,” she explains. “Now, we have proof. We speak the language of data, and elected officials listen.”
Behind the scenes, maintaining a city-wide mesh of environmental monitors presents technical challenges. Sensors can drift out of calibration over time, and harsh weather events sometimes knock units offline. To counteract these issues, the research team designed a routine self-check: each node periodically measures an onboard reference resistor whose value changes predictably with temperature. By comparing that reading to lab-tested performance curves, the network automatically flags units needing recalibration. Additional checks monitor battery voltage and signal strength, sending alert messages when maintenance is required.
Data gaps created by temporary outages are filled through machine-learning interpolation. By training regression models on patterns from neighboring sensors and historical trends, missing data can be estimated with surprising accuracy. While not a perfect substitute for real measurements, this approach ensures continuous coverage even when individual nodes go dark.
Looking ahead, the project team plans to expand the sensor suite to include soil moisture probes, wind speed cups, and solar radiation detectors. The goal is a holistic picture of urban meteorological dynamics, offering insights into everything from rooftop solar potential to lawn irrigation needs. Deeper integration with satellite thermal imagery is also on the roadmap, combining ground-level precision with broad aerial context.
Artificial intelligence will further enhance predictive capabilities. By feeding the growing dataset into neural network models, researchers hope to forecast extreme heat events at the block level up to 48 hours in advance. Such localized weather alerts could trigger automated dispatch of mobile cooling units, smart sprinkler systems, or emergency outreach to at-risk residents.
The success of the pilot cities has sparked interest from municipalities around the globe. Community groups in Europe, Asia, and South America are exploring how to replicate the network using locally available components. A shared online repository hosts translations of assembly guides, calibration protocols, and outreach materials, fostering a global community of practice.
Ultimately, the project underscores a broader shift in how science meets society. No longer confined to ivory-tower laboratories, environmental research is becoming a participatory endeavor. By placing monitoring tools directly into the hands of citizens, the initiative not only generates richer data but also ignites collective action. As urban populations swell and climate risks intensify, this ground-up approach to understanding and adapting to microclimates may prove essential.
For readers inspired to join or start their own microclimate mapping project, the first step is as simple as ordering a few temperature-humidity sensors and a microcontroller. Even a handful of devices can begin to reveal striking patterns in local heat exposure. From there, the network grows organically, fueled by curiosity and the shared desire for cooler, healthier streets. In the fight against urban heat, everyone can be a scientist and every sidewalk an observatory.