Location
Mount Vernon, WA 98274

Location
Mount Vernon, WA 98274
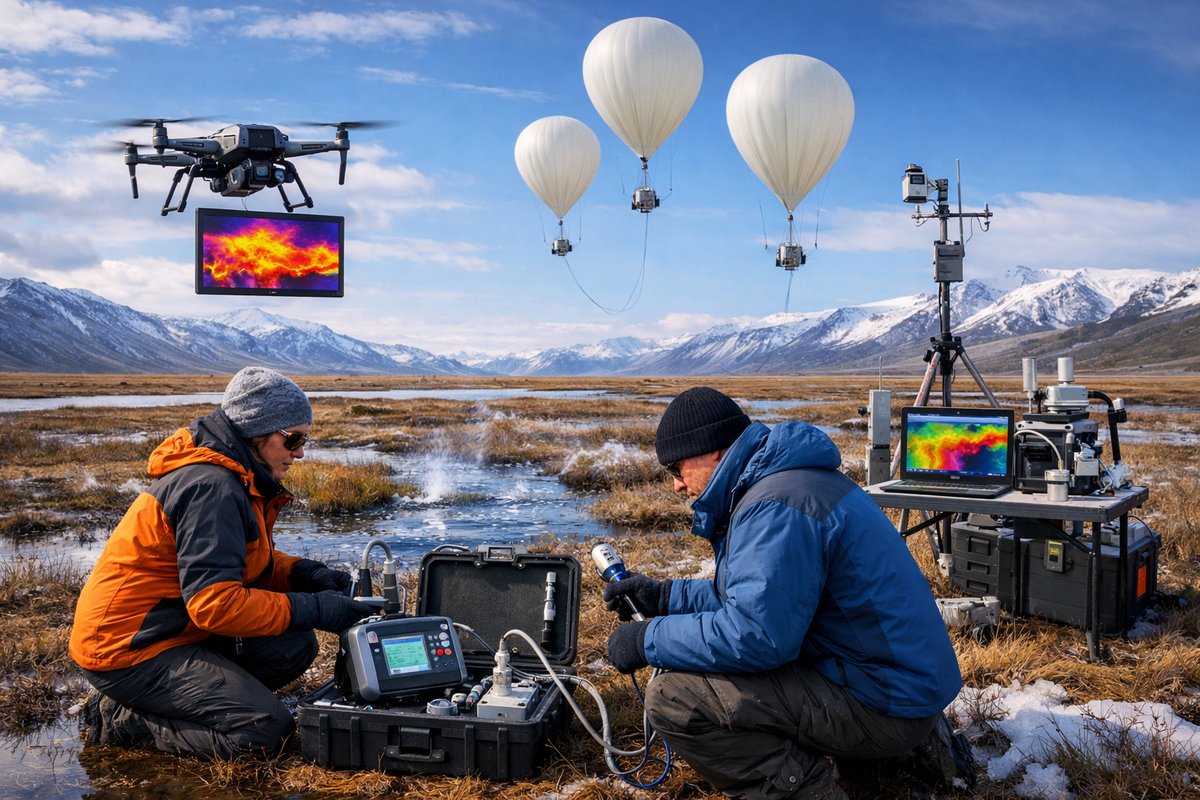
A collaborative expedition is deploying a trio of high-altitude balloons, thermal imaging drones, and portable gas analyzers across remote Arctic tundra to map seasonal methane leaks. Early data reveal surprising methane hotspots tied to rapid permafrost thaw, offering fresh insights for climate models and policy responses.
A vast expanse of frozen soil stretches toward the horizon as a team of researchers prepares to launch a weather balloon from the edge of a remote Arctic outpost. Below, technicians calibrate handheld gas analyzers while drone pilots ready small UAVs outfitted with thermal cameras. This three-pronged sensing network, a first of its kind, aims to map methane emissions across a kilometer-wide stretch of thawing permafrost that has long eluded precise measurement.
The effort brings together autonomous solutions and citizen science in a bid to expose seasonal methane patterns faster and more accurately than satellite observations alone can achieve. High-altitude balloons lift compact sensor payloads into the lower stratosphere, offering vertical profiles of methane, carbon dioxide, and temperature. Below them, thermal imaging drones survey the patchwork of melting ponds and fissured ground where methane bubbles can escape. And on the tundra, researchers armed with portable gas detectors trace emissions at ground level, logging real-time data into a shared platform that updates within minutes.
Central to the campaign are handheld gas analyzers equipped with laser-based sensing modules capable of detecting methane concentrations down to parts per billion. These portable units allow field teams to scan subtle emission points that would otherwise be invisible to satellites. Analysts can pinpoint a hidden seep beneath a thaw pond or verify a sudden spike picked up by a passing balloon. The analyzers run on rechargeable batteries designed to withstand subzero temperatures, ensuring uninterrupted monitoring even when the mercury dips well below freezing.
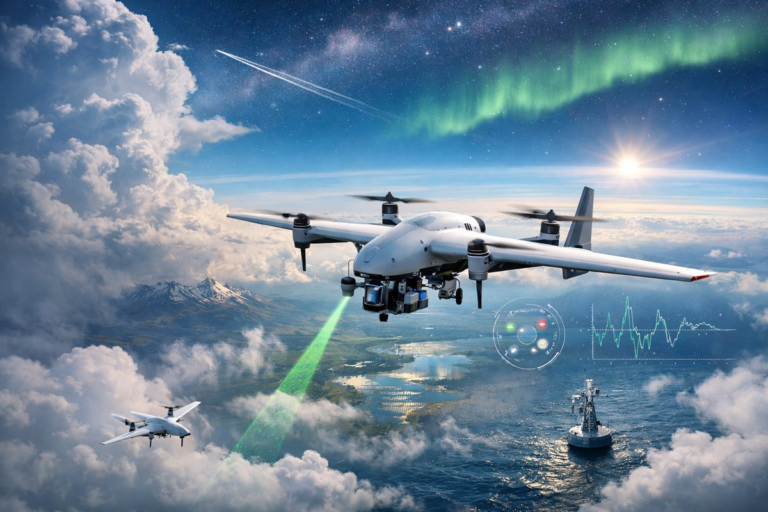
Above the ground, small drones fitted with thermal imaging cameras perform systematic grid flights. Thermal maps reveal temperature anomalies associated with active methane vents, where gas escaping from warming soil cools the surface through endothermic reactions. In one recent flight, a drone detected a cluster of vents in an area previously thought to be inert, prompting a rapid follow-up inspection by ground teams. The ability to overlay thermal data with methane concentrations is offering a multidimensional view of how thaw dynamics drive gas release.
Complementing drones and handheld sensors, high-altitude balloons ascend to heights of 20 kilometers carrying lightweight sensor modules and GPS trackers. As they drift on upper winds, the balloons collect vertical slices of the atmosphere, measuring both methane and carbon dioxide profiles at different altitudes. The data help establish background concentration baselines and identify plumes emanating from the thaw zone below. Once the balloon reaches its programmed altitude limit, a parachute deploys and carries the module back for recovery and recalibration, readying it for the next launch.
In an initial pilot study covering a 10-square-kilometer area, the network logged unexpected methane hotspots concentrated around old thermokarst lakes-depressions formed by melting ice cores in the permafrost. Ground sensors in one lake bed recorded methane fluxes nearly ten times higher than regional averages, while drone imagery captured thermal gradients consistent with active venting. Meanwhile, balloon data confirmed that these emissions rose into the lower stratosphere, potentially affecting atmospheric chemistry on a wider scale.
Citizen scientists stationed in nearby Arctic communities also contribute to the project. Equipped with simplified sensor backpacks and tablet-based logging apps, local participants scan their daily surroundings for telltale gas concentrations. Their inputs help refine predictive models, filling spatial gaps that remote drones and balloons cannot cover. It’s a symbiotic approach: researchers gain continuous ground-level coverage, and residents benefit from real-time environmental awareness in a region where climate impacts are accelerating.
Satellite data play a supporting role, offering broad context for the high-resolution local measurements. Synthetic aperture radar (SAR) imagery tracks changes in surface water extent and soil moisture, which correlate closely with methane release potential. Combined with publicly available thermal infrared maps, the satellite inputs help guide balloon release schedules and drone flight paths, ensuring that sensors concentrate on the most dynamic zones.
Early analyses have identified significant discrepancies between observed methane fluxes and values predicted by current climate models for the region. In several cases, sensors recorded short-lived emission spikes coinciding with midday thaw pulses-phenomena that modelers had underestimated. The new data are feeding into simulation frameworks, prompting recalibrations that could adjust global methane budget estimates.
The implications extend beyond academic circles. Rapid permafrost thaw is projected to accelerate under warming scenarios, potentially turning Arctic soils from carbon sinks into methane sources. Accurate, high-resolution measurements are crucial for policymakers assessing the urgency and scale of mitigation strategies. The sensing network’s findings are already slated for presentation at an upcoming international climate summit, where delegates will discuss how to integrate real-time monitoring into global reporting standards.
Partnerships with indigenous communities have been essential in shaping the research design and ensuring ethical data sharing. Local elders have helped identify traditional ecological knowledge indicators-such as changes in vegetation and animal behavior-that often precede observed methane spikes. By combining ancestral insights with modern sensing technology, the project embodies a holistic approach to understanding and responding to environmental change in the Arctic.
All collected data flow into an open-access platform where researchers, community members, and policymakers can visualize methane concentrations in near real time. Interactive maps display sensor readings, thermal overlays, and flight tracks, while time-lapse features reveal how emissions evolve throughout the thaw season. The platform also supports data exports for external analysis, fostering collaboration across institutions.
Despite its promise, the network faces challenges. Extreme weather can ground drones for days, and recovering parachuted sensor modules in deep snowfields can be logistically demanding. Battery performance degrades in cold, requiring redundant systems and careful power management. Researchers are exploring solar-powered charging stations and ruggedized enclosures to improve reliability in harsh conditions.
Looking ahead, the team plans to expand the network across a broader arc of the Arctic coastline, incorporating marine measurements to capture methane release from submerged permafrost in coastal shelves. They are also testing underwater robots equipped with methane sensors to survey offshore seepage. The modular design of the current system allows new sensor types to be integrated with minimal hardware redesign, enabling rapid adaptation to emerging research needs.
As the Arctic warms at twice the rate of the global average, understanding the feedback loops between thawing permafrost and greenhouse gas emissions is more urgent than ever. By weaving together high-altitude balloons, thermal imaging drones, portable gas analyzers, satellite data, and community engagement, this sensing network is setting a new standard for climate monitoring. The lessons learned here could inform broader efforts from mountain ranges to tropical wetlands, wherever hidden emissions may be reshaping Earth’s atmosphere.
In the fading Arctic daylight, a final balloon drifts skyward, its payload beaming data back to a snowbound lab. Each data point carries a fragment of a larger story-one of a planet in transition and the science-driven quest to decode its subtle signals before they slip beyond our grasp.